A plain-English look at how donut.build turns auction listings into price history charts.
Written by maintainer of donut.build
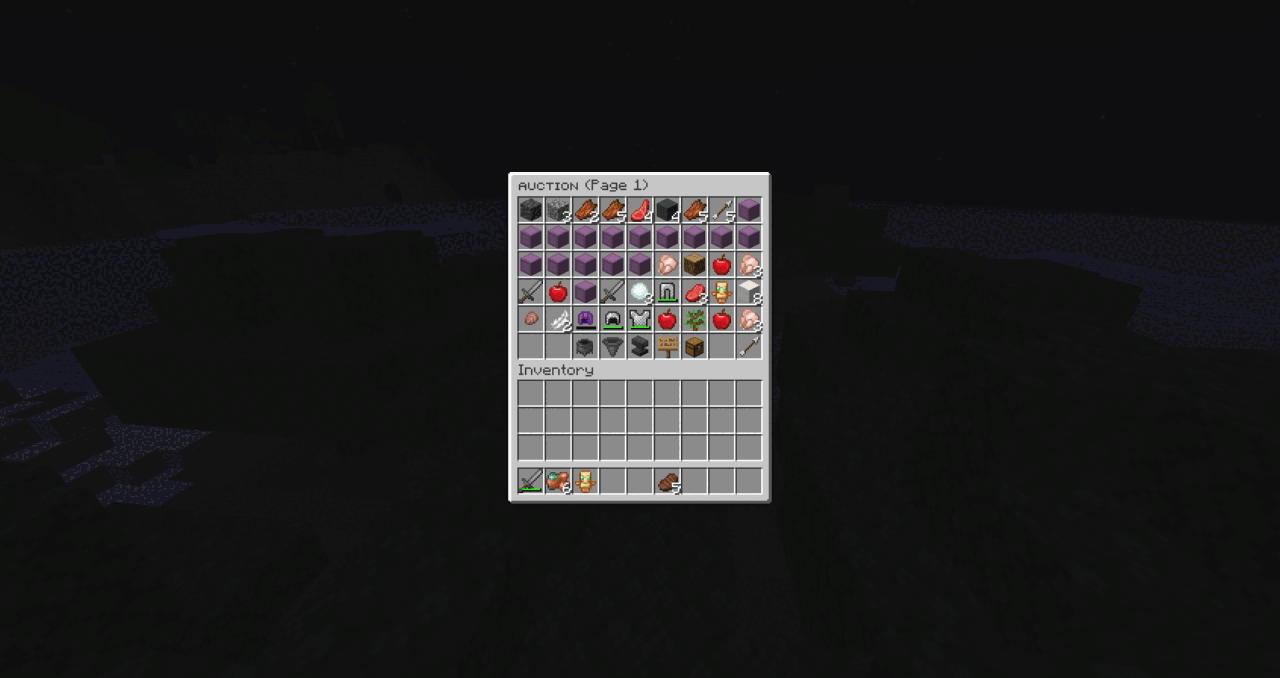
We built the auction pages to answer a very normal Minecraft question: what is this item actually selling for right now? Instead of guessing, we run a snapshot job that checks the auction house, cleans the results, and stores a price point for each tracked item.
The important part is this: we do not invent a magic number. We read real auction listings, compare them fairly, and keep the cheapest valid per-item sample from that run.
Auction listings come in different sizes. One player might list 64 items, while another lists only 16. If we only compared total prices, the bigger stack would always look more expensive even when it is actually the better deal.
So we divide the total listing price by the item count. That gives us a fair price per item. It is the simplest way to compare apples to apples.
This system is tuned to find the cheapest valid market sample quickly. That is useful for players who want a realistic buying price, but it also means one unusually cheap listing can pull the tracked value downward for that snapshot.
These tracked auction prices power the item history pages and also feed into schematic material cost estimates.
Sign in to leave a comment.
No comments yet.